Catch the 500 before users do.
Every production failure arrives with the stack, route, and context to become repair work.
How it works
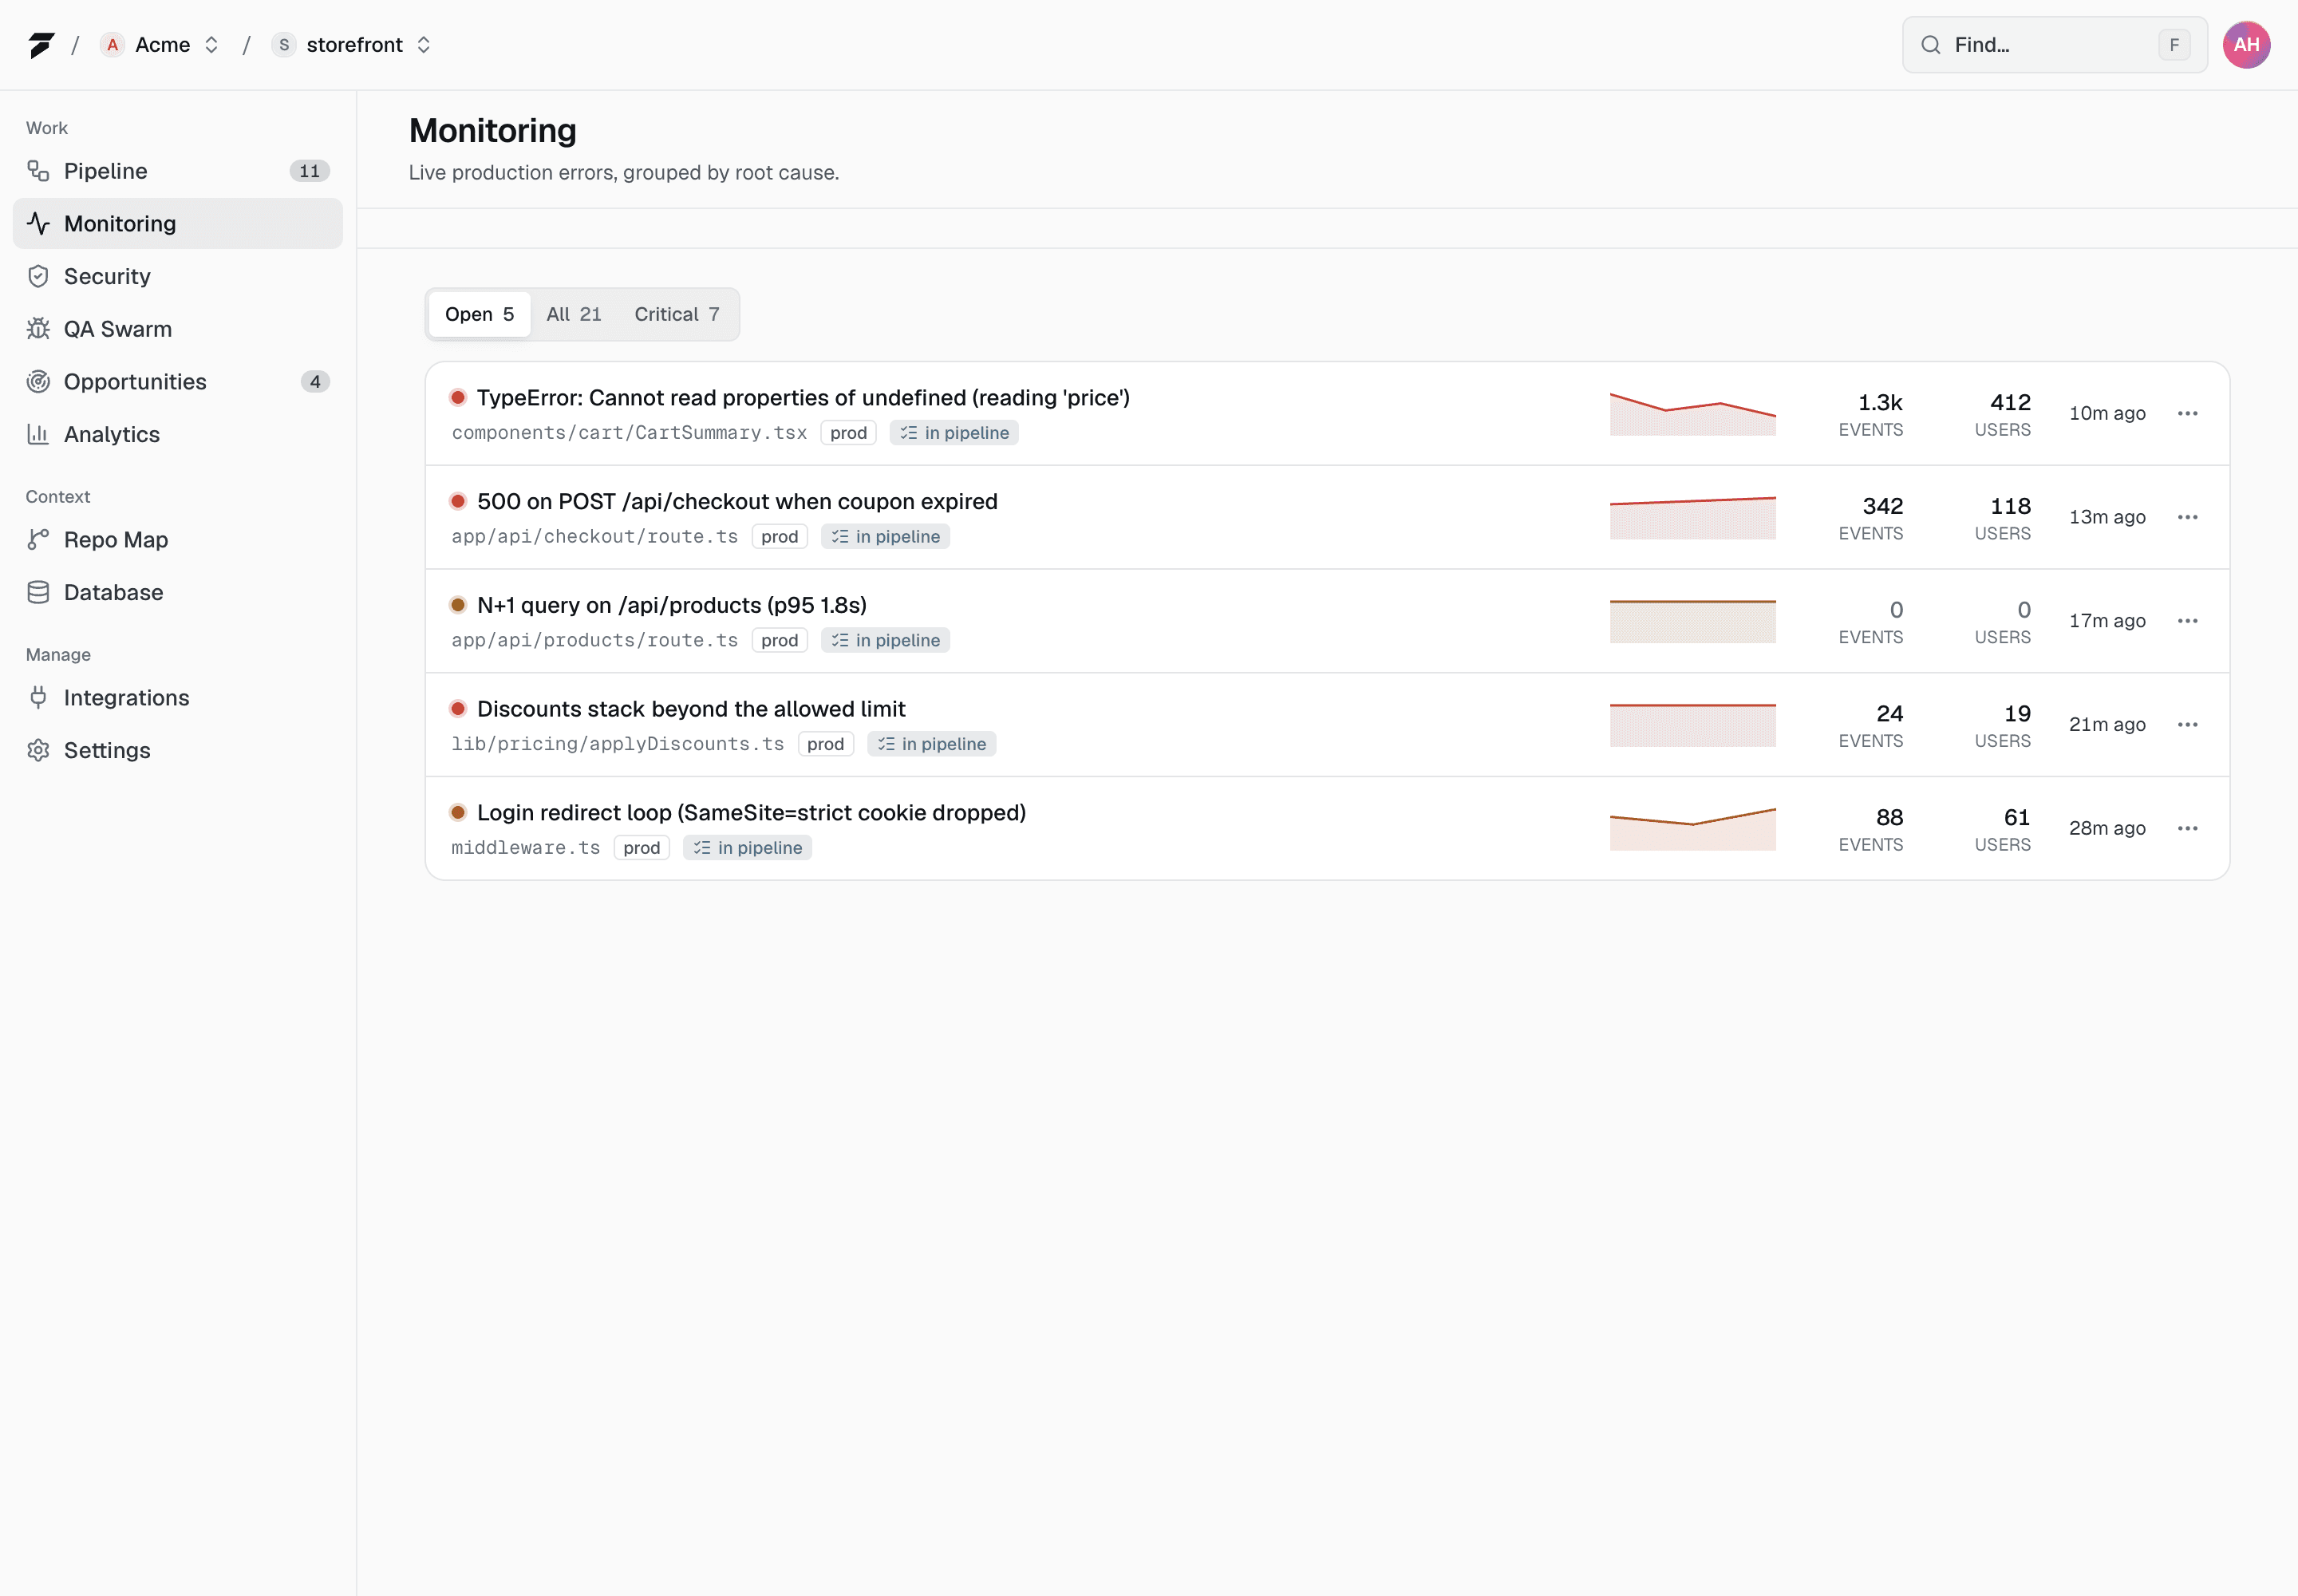
Catch browser and server failures and turn them into fixable work.
Install the agent
Drop To200 into the app once. It watches uncaught errors, rejected promises, failed resource loads, and server-side request errors.
Group the failure
Repeated events are fingerprinted into one issue so the team sees the pattern instead of a stream of noise.
Open repair work
The issue moves into the pipeline with enough context for the AI to diagnose a likely cause and prepare a fix.
$ to200 watch --production
signal uncaught error
payload stack + breadcrumbs
outcome repair task
✓ Check results attached to the PR
In practice
What it replaces
Screenshots in Slack
Errors arrive with stack, release, route, and breadcrumbs instead of vague user reports.
Manual ticket creation
First sightings become repair work automatically; repeat events update the same issue.
Disconnected observability
Runtime signal feeds the same pipeline that diagnoses, fixes, and verifies the problem.
FAQ
Questions, answered.
Do we need a separate monitoring tool?
No. To200 ships its own capture agent — browser and server failures arrive with the stack, release, and breadcrumbs the repair loop needs to diagnose and prepare fixes.
Can it monitor Vercel and Supabase too?
Yes. When those integrations are connected, To200 can use deployment/runtime logs and database context during monitoring and repair.